

ASX Model Book Analysis: 5 Monster Momentum Stocks Revealed
- Christopher Hall
- Sep 19, 2025
- 6 min read

Updated: Feb 17
Learning from Market Leaders: The Model Book Approach
What separates successful momentum traders from the rest? They study the greatest market winners to understand the patterns that created extraordinary gains. At Finer Market Points, our Model Book series examines ASX momentum trading through detailed analysis of the market's strongest performers, revealing the systematic approaches that professional traders use to identify future leaders.
This comprehensive analysis of five standout ASX companies demonstrates why momentum stocks move in predictable patterns and how understanding these setups can build your confidence in market timing decisions.
The companies examined - Regis Healthcare, Catapult Group, SKS Technologies, Step One, and Findi - each delivered exceptional returns by following similar technical patterns. Understanding these formations provides educational insights into how momentum develops and why certain stocks become market leaders.
What is Relative Strength and Why Does it Matter at Market Lows?
The most critical characteristic shared by all five companies was demonstrating relative strength during significant market pullbacks. When the broader ASX experienced deep corrections in October 2022, March 2023, and October 2023, these future leaders showed resilience by maintaining higher lows or, more importantly, achieving new 52-week highs within weeks of market bottoms.
This phenomenon isn't coincidental. Professional momentum traders systematically monitor which stocks reach new highs immediately after market weakness. When the general market pulls back 5% or more, stocks that achieve 52-week highs within two weeks of the low often become the next cycle's biggest winners.

The educational principle here centers on understanding market psychology. While most investors focus on falling prices during corrections, momentum leaders attract buying interest precisely when pessimism peaks. This creates the foundation for sustained upward moves once broader market confidence returns.
Technical Pattern Recognition: The Same Setups Repeatedly
Volatility Contraction Patterns (VCPs)
Each company exhibited classic VCP formations multiple times during their advance. These patterns occur when a stock undergoes increasingly smaller price swings, creating a coiling effect that often precedes explosive moves. The educational value lies in recognising how successful momentum stocks rarely move straight up - they advance through a series of breakouts and controlled pullbacks.
The key elements include:
Price contractions that become progressively tighter
Volume that diminishes during pullbacks
Breakouts accompanied by increased volume
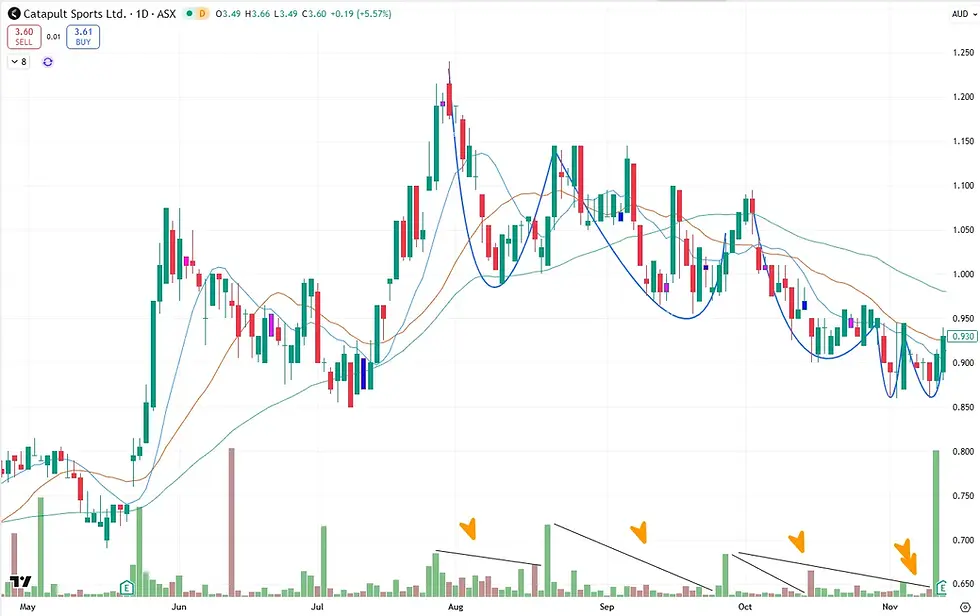
Catapult (CAT) displaying a high-quality VCP pattern with dramatic volatility compression (18% → 12% → 7% contractions). Notice how each pullback becomes progressively smaller - this "coiling spring" effect often precedes explosive advances as supply exhaustion meets institutional demand. Support levels that hold during corrections
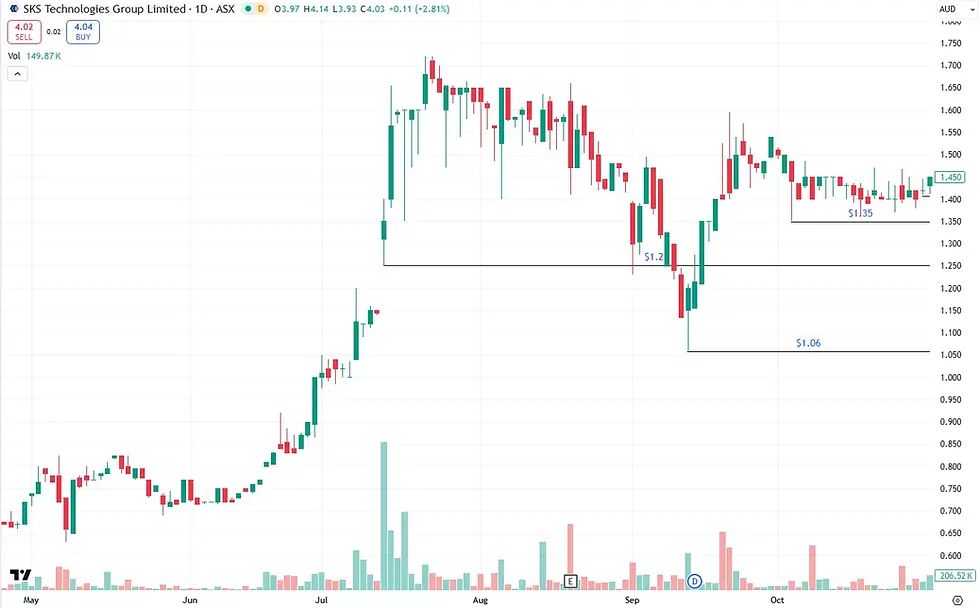
Cup and Handle Formations
Several companies displayed textbook cup and handle patterns, particularly after initial momentum phases. These formations represent healthy consolidation periods where early buyers take profits while new accumulation occurs at higher price levels.
Why Are 52-Week Highs Important for Momentum Stocks?
Breaking to new 52-week highs emerged as a crucial trigger across all five companies. This technical event often signals a change in character, particularly for companies that have undergone operational improvements or strategic repositioning.
The educational insight is that 52-week highs create psychological momentum that attracts institutional attention and broader market participation.
How Do Professional Traders Use Volume Analysis?
Volume patterns provided consistent signals throughout these momentum cycles. The analysis revealed several key principles:
Expansion on Breakouts: Every significant price advance was accompanied by above-average volume, indicating genuine buying interest rather than low-liquidity price movement.
Contraction During Pullbacks: Healthy corrections showed minimal selling volume, suggesting limited distribution by existing holders.
Exhaustion Signals: Massive volume spikes after extended runs often marked temporary exhaustion points, providing insights for managing position size during aggressive moves.
What is the 1% Risk Rule in Trading?
The analysis highlighted how professional traders manage position sizing through systematic risk control. The 1% rule means never risking more than 1% of total capital on any single trade, regardless of position size.
For example, with a $100,000 account, maximum risk per trade should be $1,000. This allows for building larger positions as stocks move favorably by adjusting stop levels higher while maintaining the same risk amount. Professional momentum traders often start with smaller positions and add to winners, creating substantial position sizes with controlled downside risk.
The Psychology of Momentum: Why Stocks Move in Packs
The concept that "stocks move in packs" was evident throughout the analysis. Companies in similar sectors or themes often experience momentum phases simultaneously, driven by:
Sector rotation patterns
Thematic investment flows
Institutional portfolio adjustments
Market cycle positioning
This understanding helps explain why individual stock analysis alone is insufficient for momentum trading. Systematic monitoring of broader sector movements and thematic trends provides context for individual opportunities.
Moving Average Behavior: Trading the Trend
Each company demonstrated distinct relationships with key moving averages during their momentum phases:
10-Day Moving Average: Often provided immediate support during the most aggressive uptrends, suggesting strong underlying momentum.
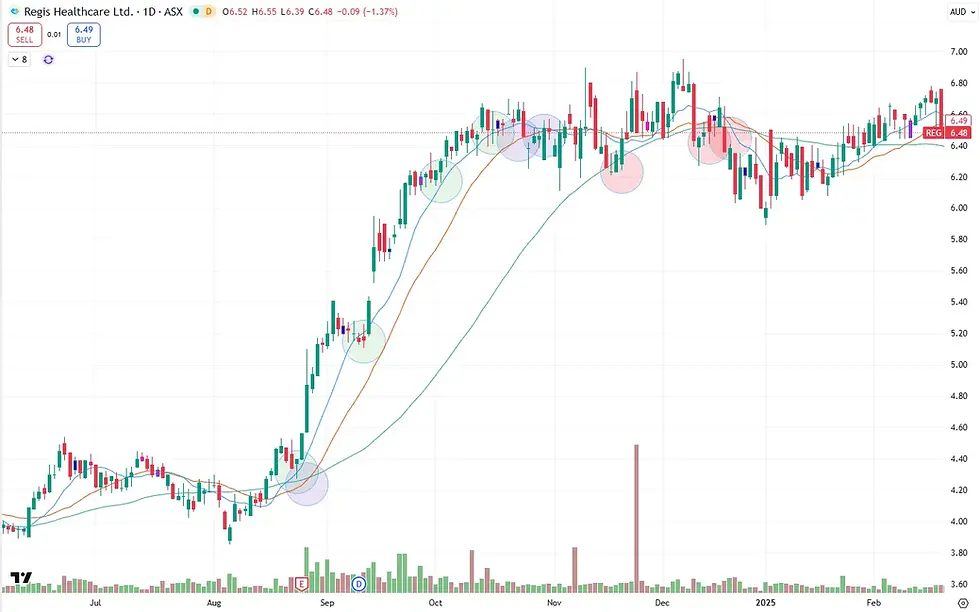
20-Day Moving Average: Served as intermediate support, particularly useful for position management during medium-term holds.
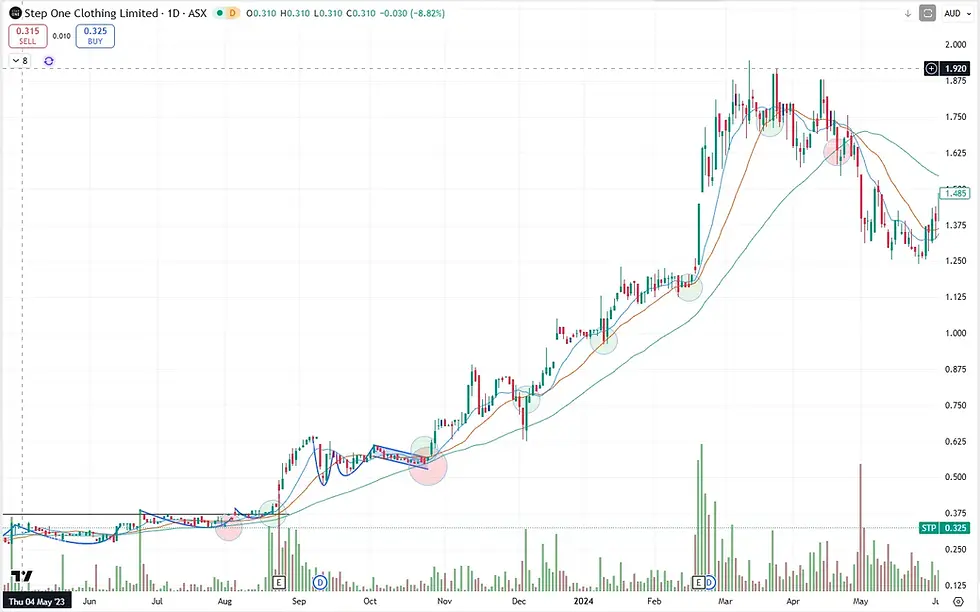
50-Day Moving Average: Acted as longer-term support and often marked significant inflection points when broken.
Remember that past performance is no guarantee of future results, and all trading involves risk. The focus should be on understanding these principles as educational tools rather than predictive indicators.
Pattern Repetition: Nothing New Under the Sun
Perhaps the most striking observation was how these modern ASX leaders exhibited the same technical characteristics documented in momentum trading literature spanning decades. Cup and handle formations, VCP patterns, and volume-price relationships haven't changed despite technological advances and market evolution.
This consistency reinforces the educational value of studying historical market leaders. The patterns that created exceptional returns in previous decades continue appearing in today's markets, suggesting that underlying market psychology remains constant.
Continue Your Momentum Trading Education
FMP YouTube members access comprehensive momentum trading education through weekly analysis, community discussions, and our complete video library. Our systematic approach monitors market patterns to identify educational opportunities for building trading confidence.
Members receive detailed analysis through our weekly educational content, community access for educational discussions, and our complete library of momentum trading education videos covering systematic learning pathways through trading education.
[EXPLORE YOUTUBE MEMBERSHIP]
Key Takeaways
The analysis of these five ASX momentum leaders reveals several critical educational principles. Successful momentum stocks typically demonstrate relative strength during market weakness, break to new 52-week highs as catalysts for major moves, and follow repetitive technical patterns including VCP formations and cup and handle setups.
Volume provides crucial confirmation signals, with expansion during breakouts and contraction during healthy pullbacks. Professional risk management through systematic position sizing enables building substantial stakes while maintaining controlled downside exposure.
The "stocks move in packs" philosophy emphasises the importance of sector and thematic analysis alongside individual company evaluation. Moving average relationships offer practical frameworks for position management during trending phases.
For Australian investors, understanding these momentum characteristics provides systematic approaches to market analysis that have proven effective across different market cycles and time periods.
Continue developing your understanding of these principles through comprehensive momentum trading education and systematic pattern recognition practice.
Disclaimer: This content is for educational purposes only and does not constitute financial advice. Past performance is no guarantee of future results. Consider your financial situation and seek professional advice before making investment decisions.
Finer Market Points Pty Ltd, CAR 1304002, AFSL 526688, ABN 87 645 284 680. This general information is educational only and not financial advice, recommendation, forecast or solicitation. Consider your objectives, financial situation and needs before acting. Seek appropriate professional advice. We accept no liability for any loss or damages arising from use.


Comments